Here is a list of maps and figures (designed by Robert Hafner, 2016):
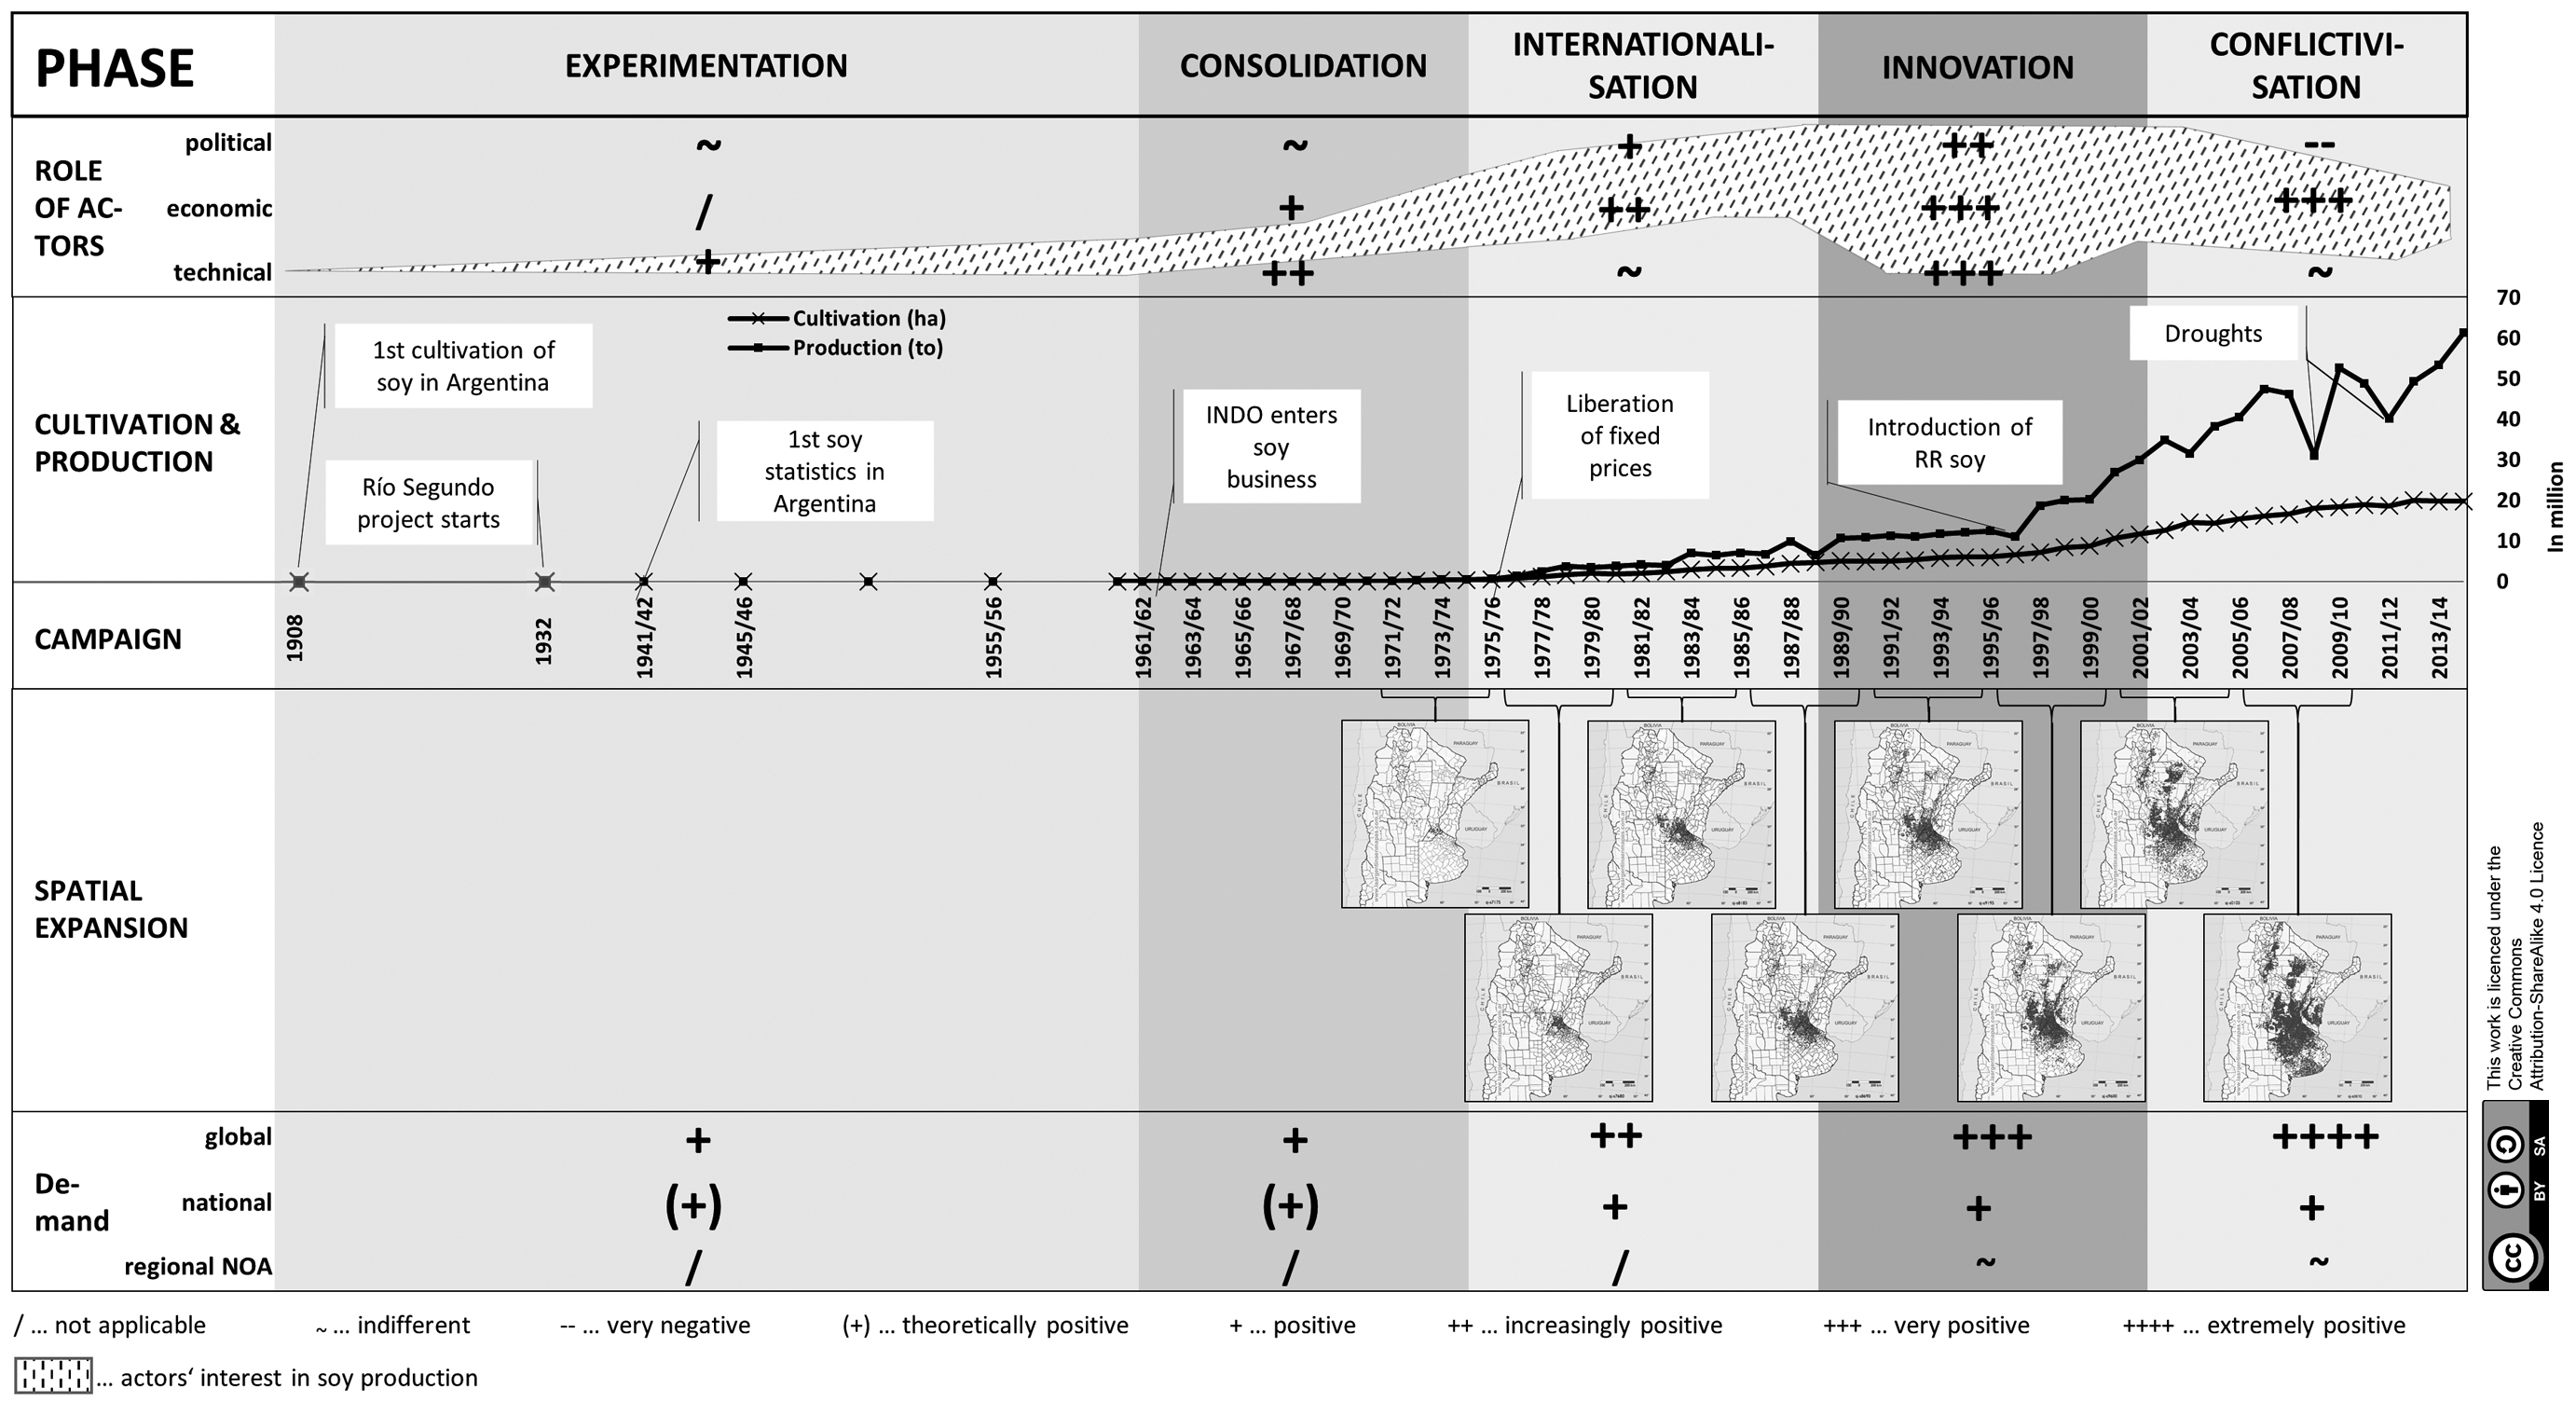
Figure: Phases of soy production in Argentina
(own elaboration based on: Bolsa de Cereales; Ministerio de Agricultura y Ganadería; Martínez Dougnac, 2013, p. 9; SIIA, 2016; PROATLAS, 2016)
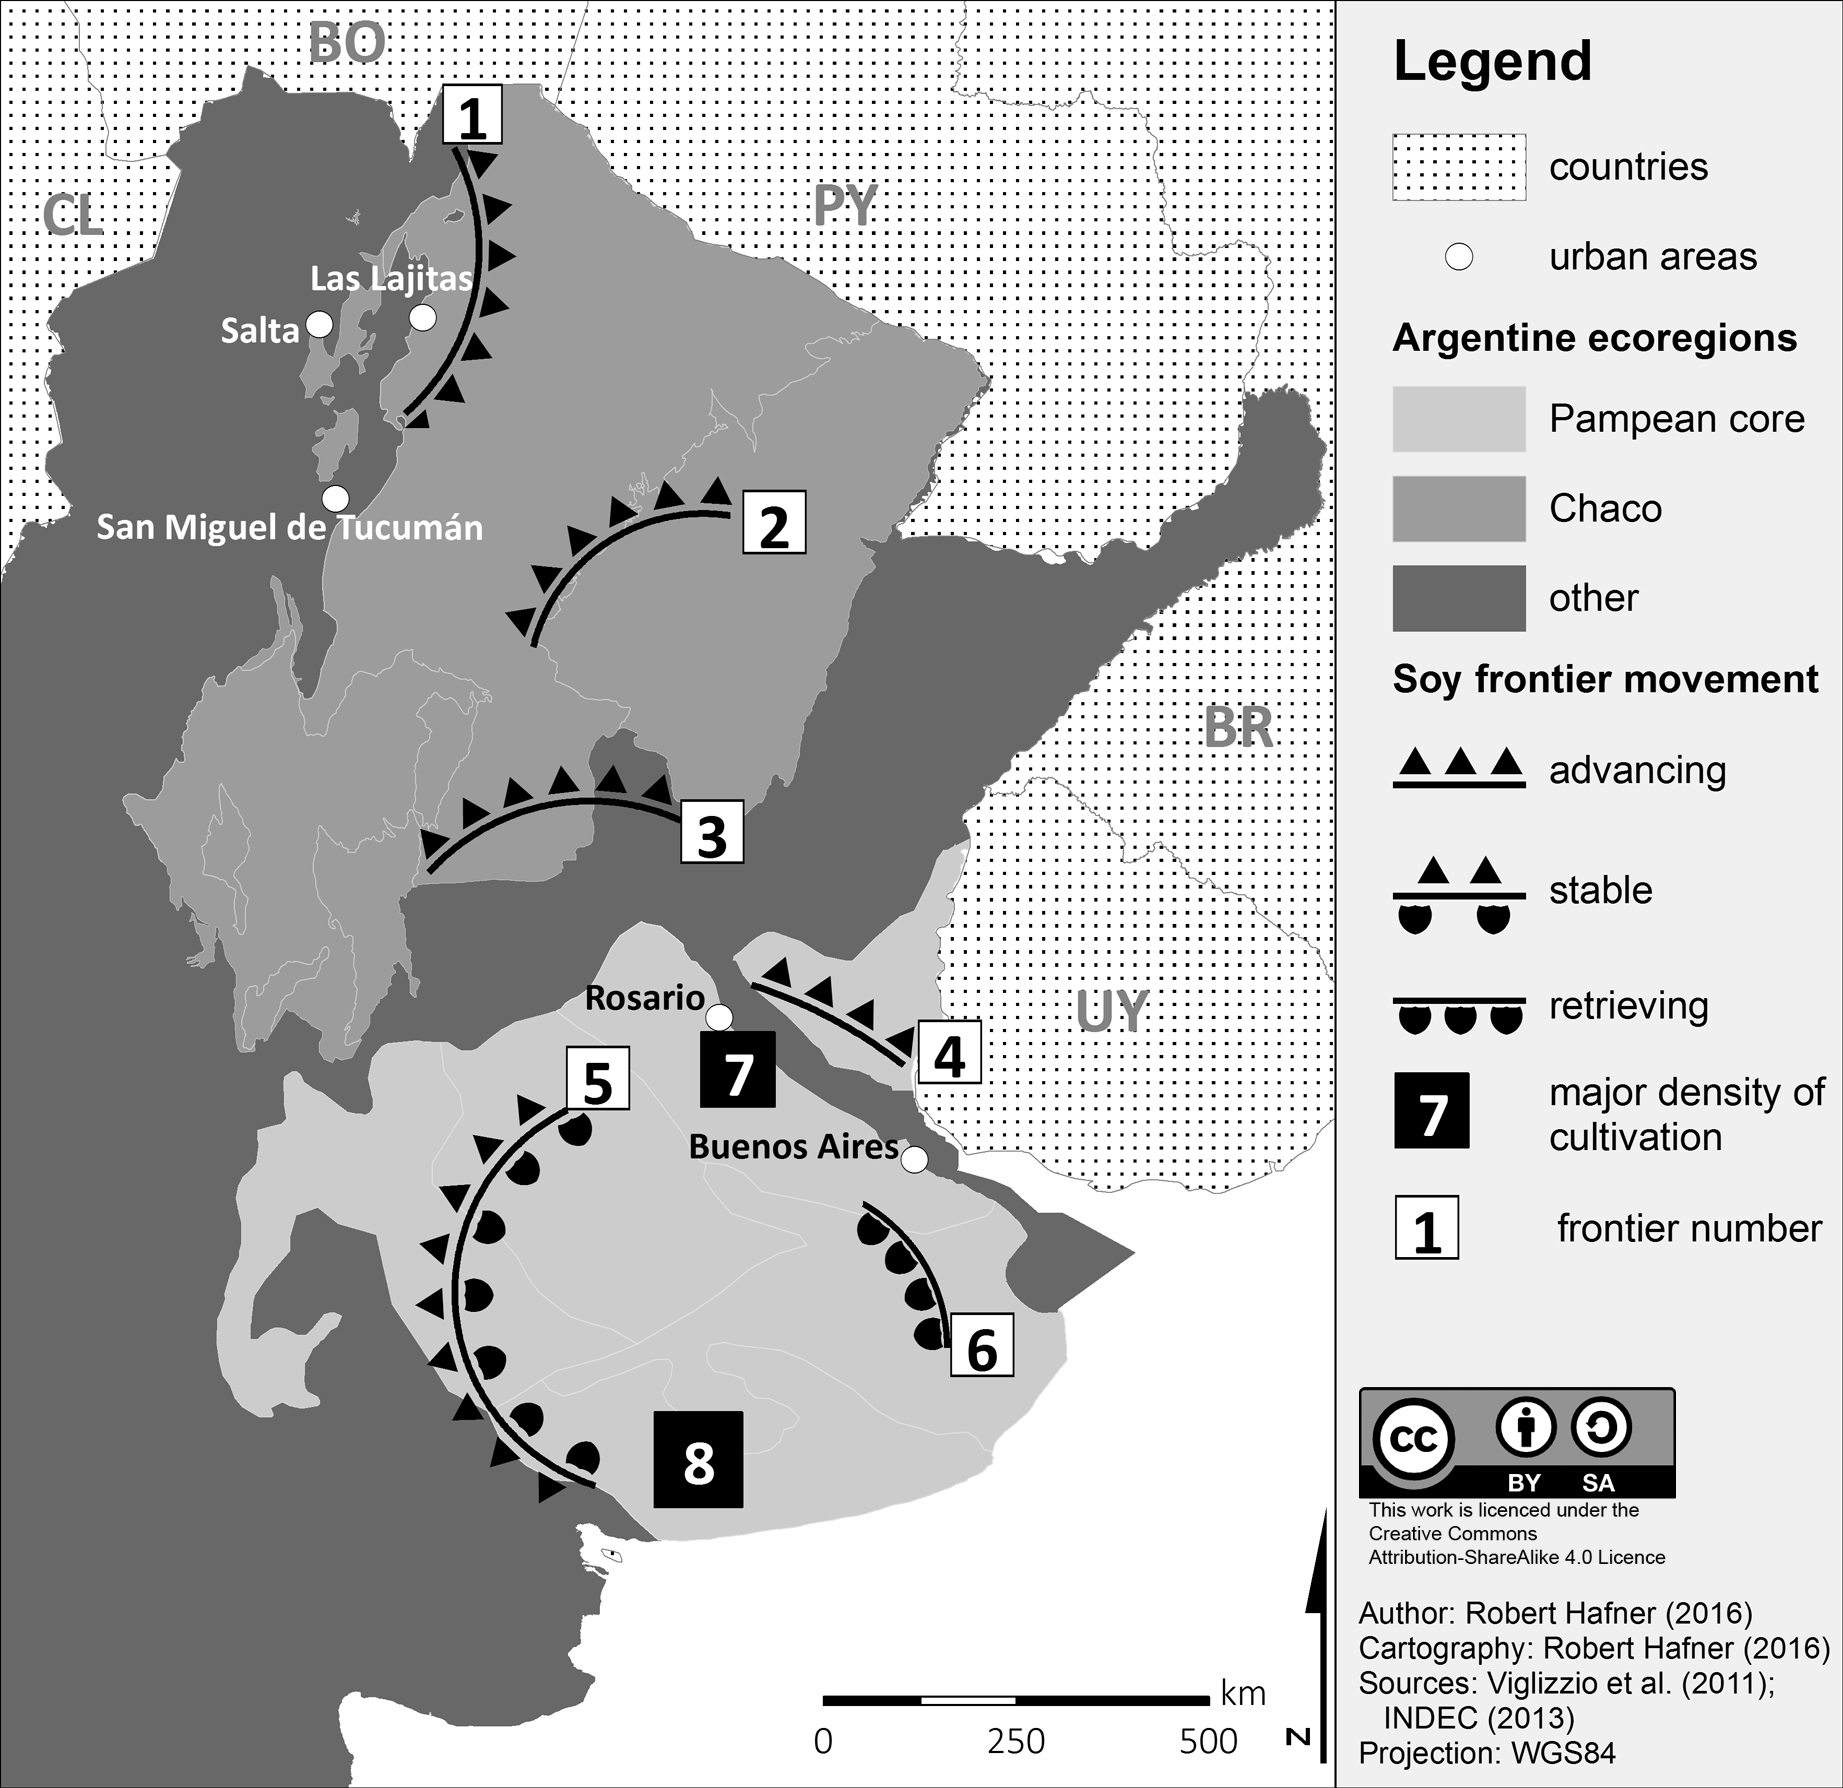
Map: Soy frontiers in Argentina and their location in respective ecoregions

Map: Change in precipitation in the Chaco Salteño 1960–2007


Map: Forest Law Zoning of the Chaco Salteño


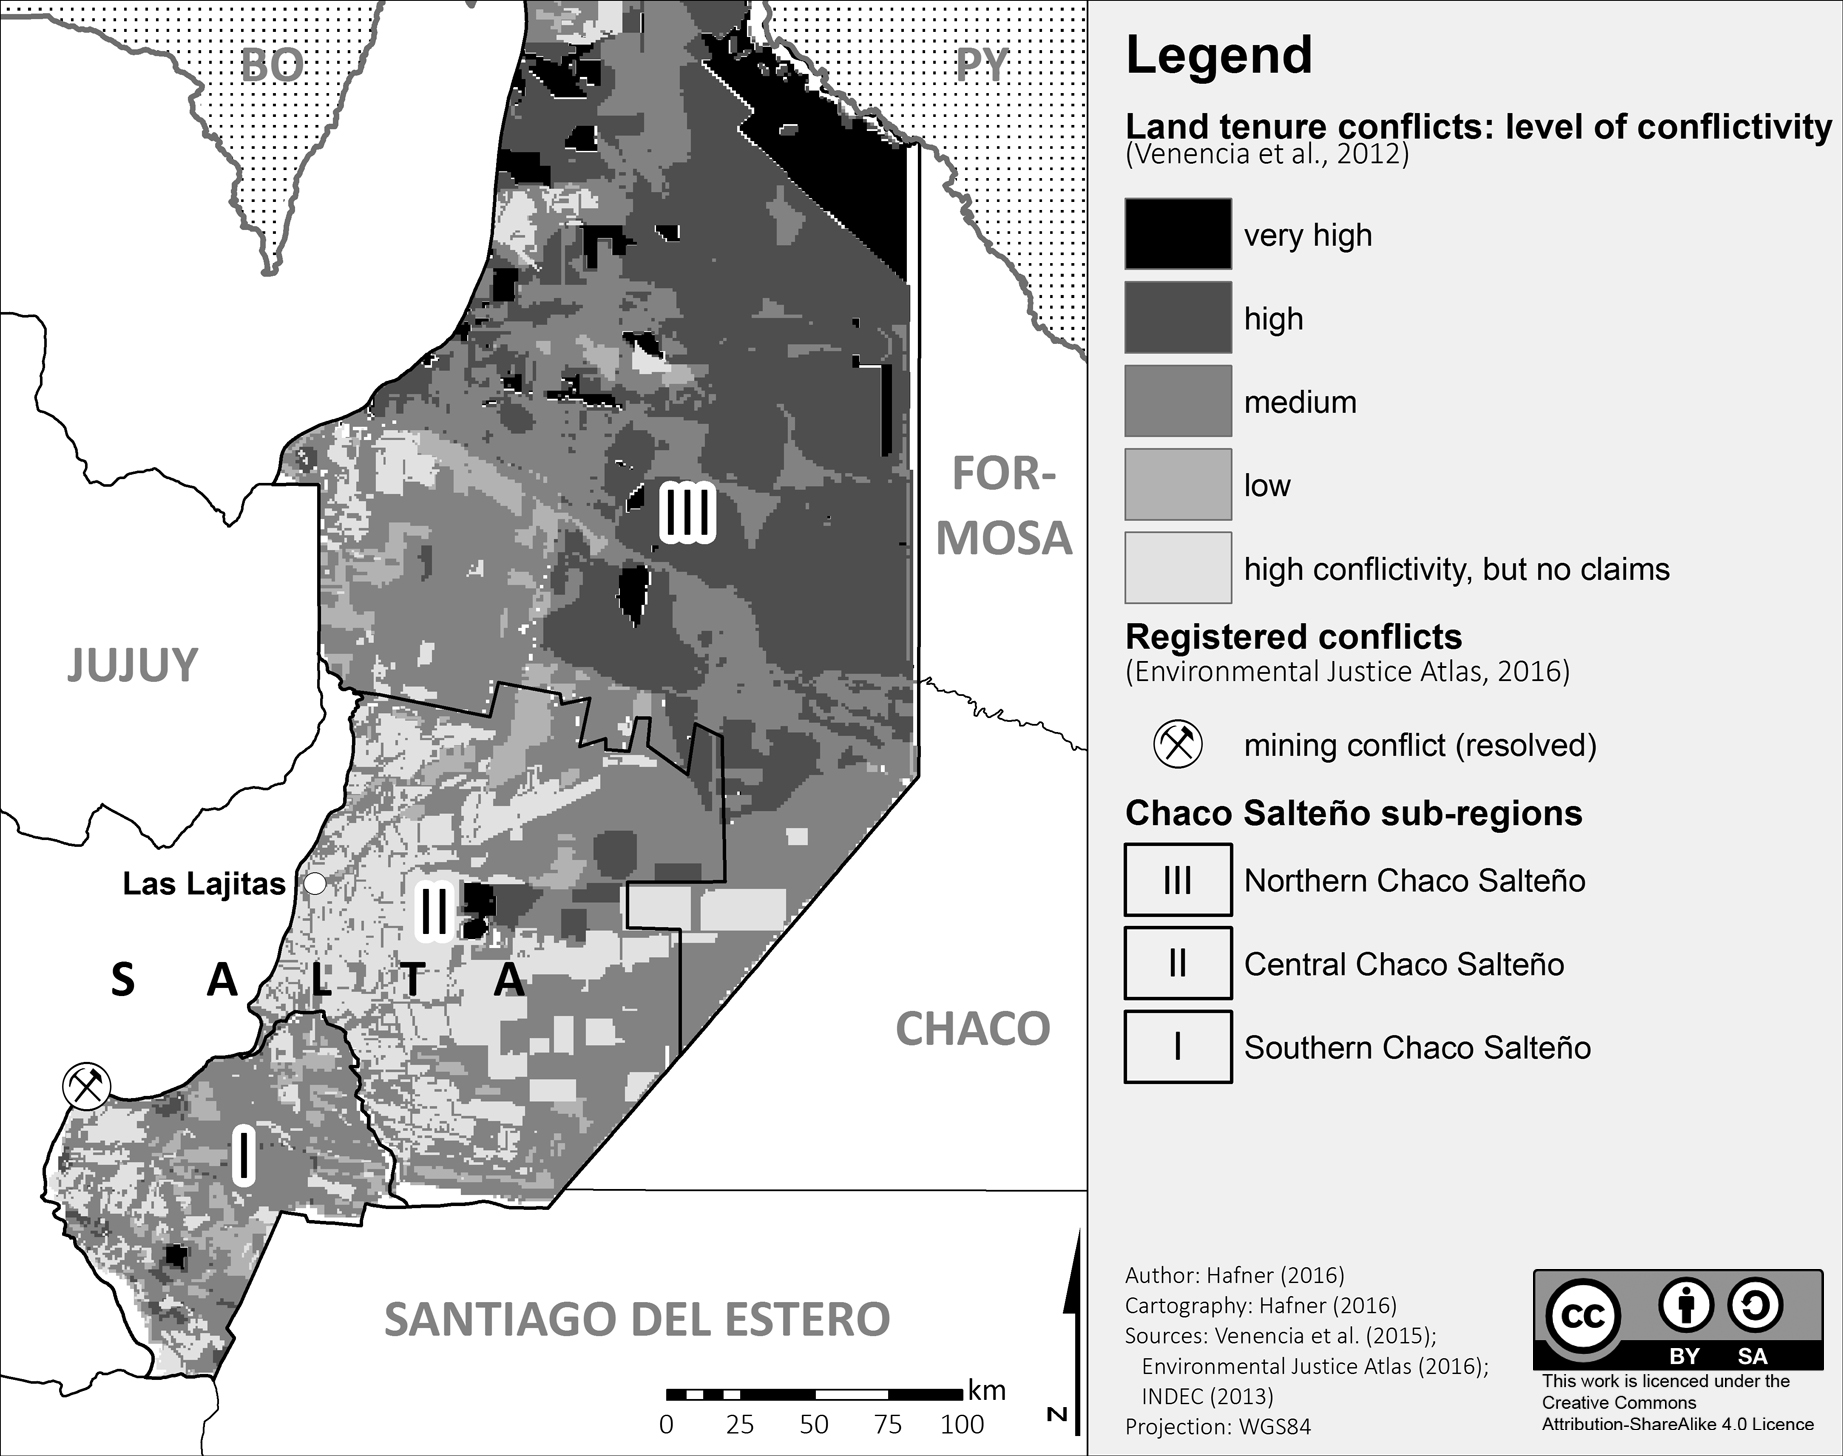
Map: Conflictivity and land tenure in the Chaco Salteño

Map: Author’s first evaluation of (visual) conflict potentials in Las Lajitas

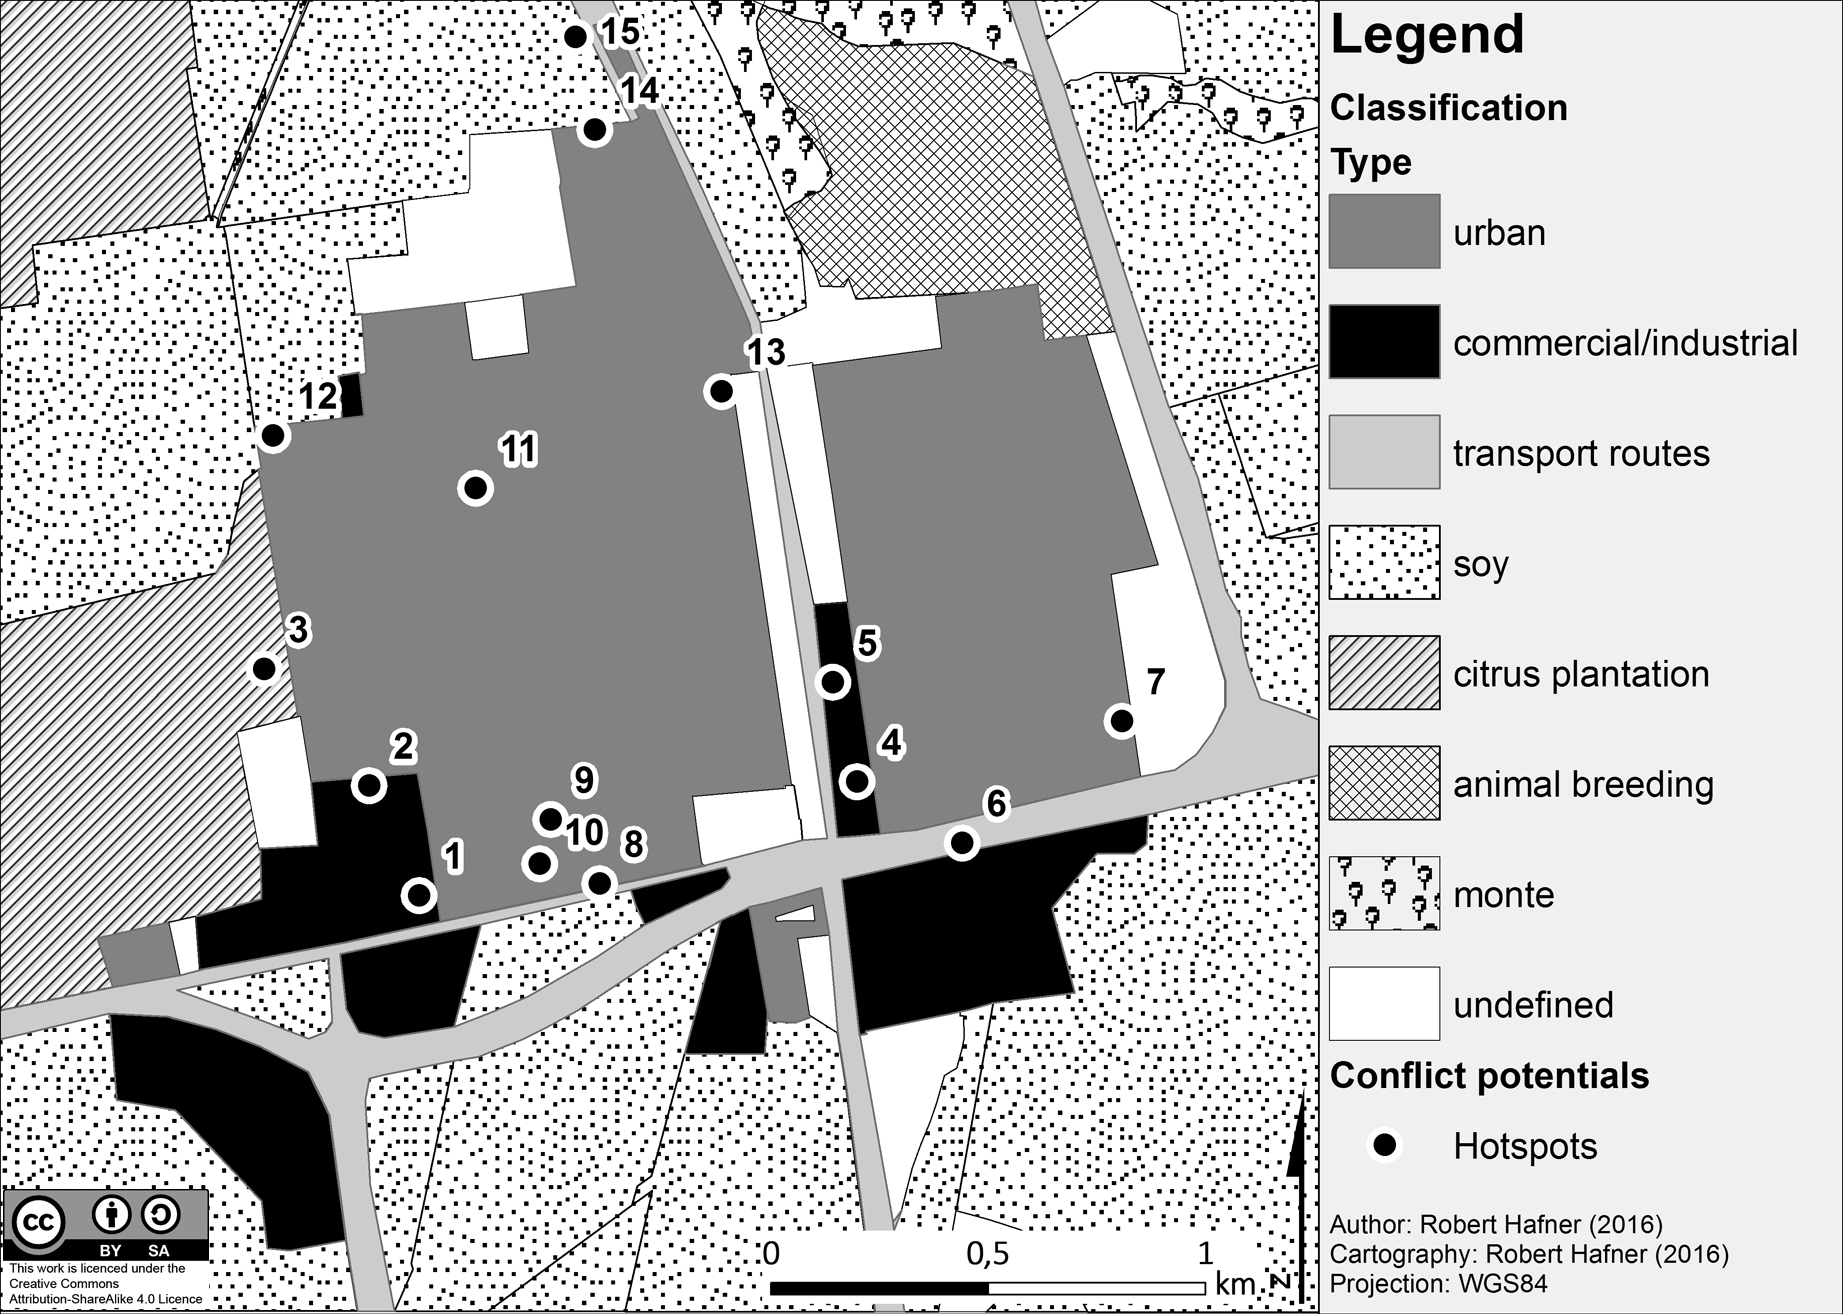
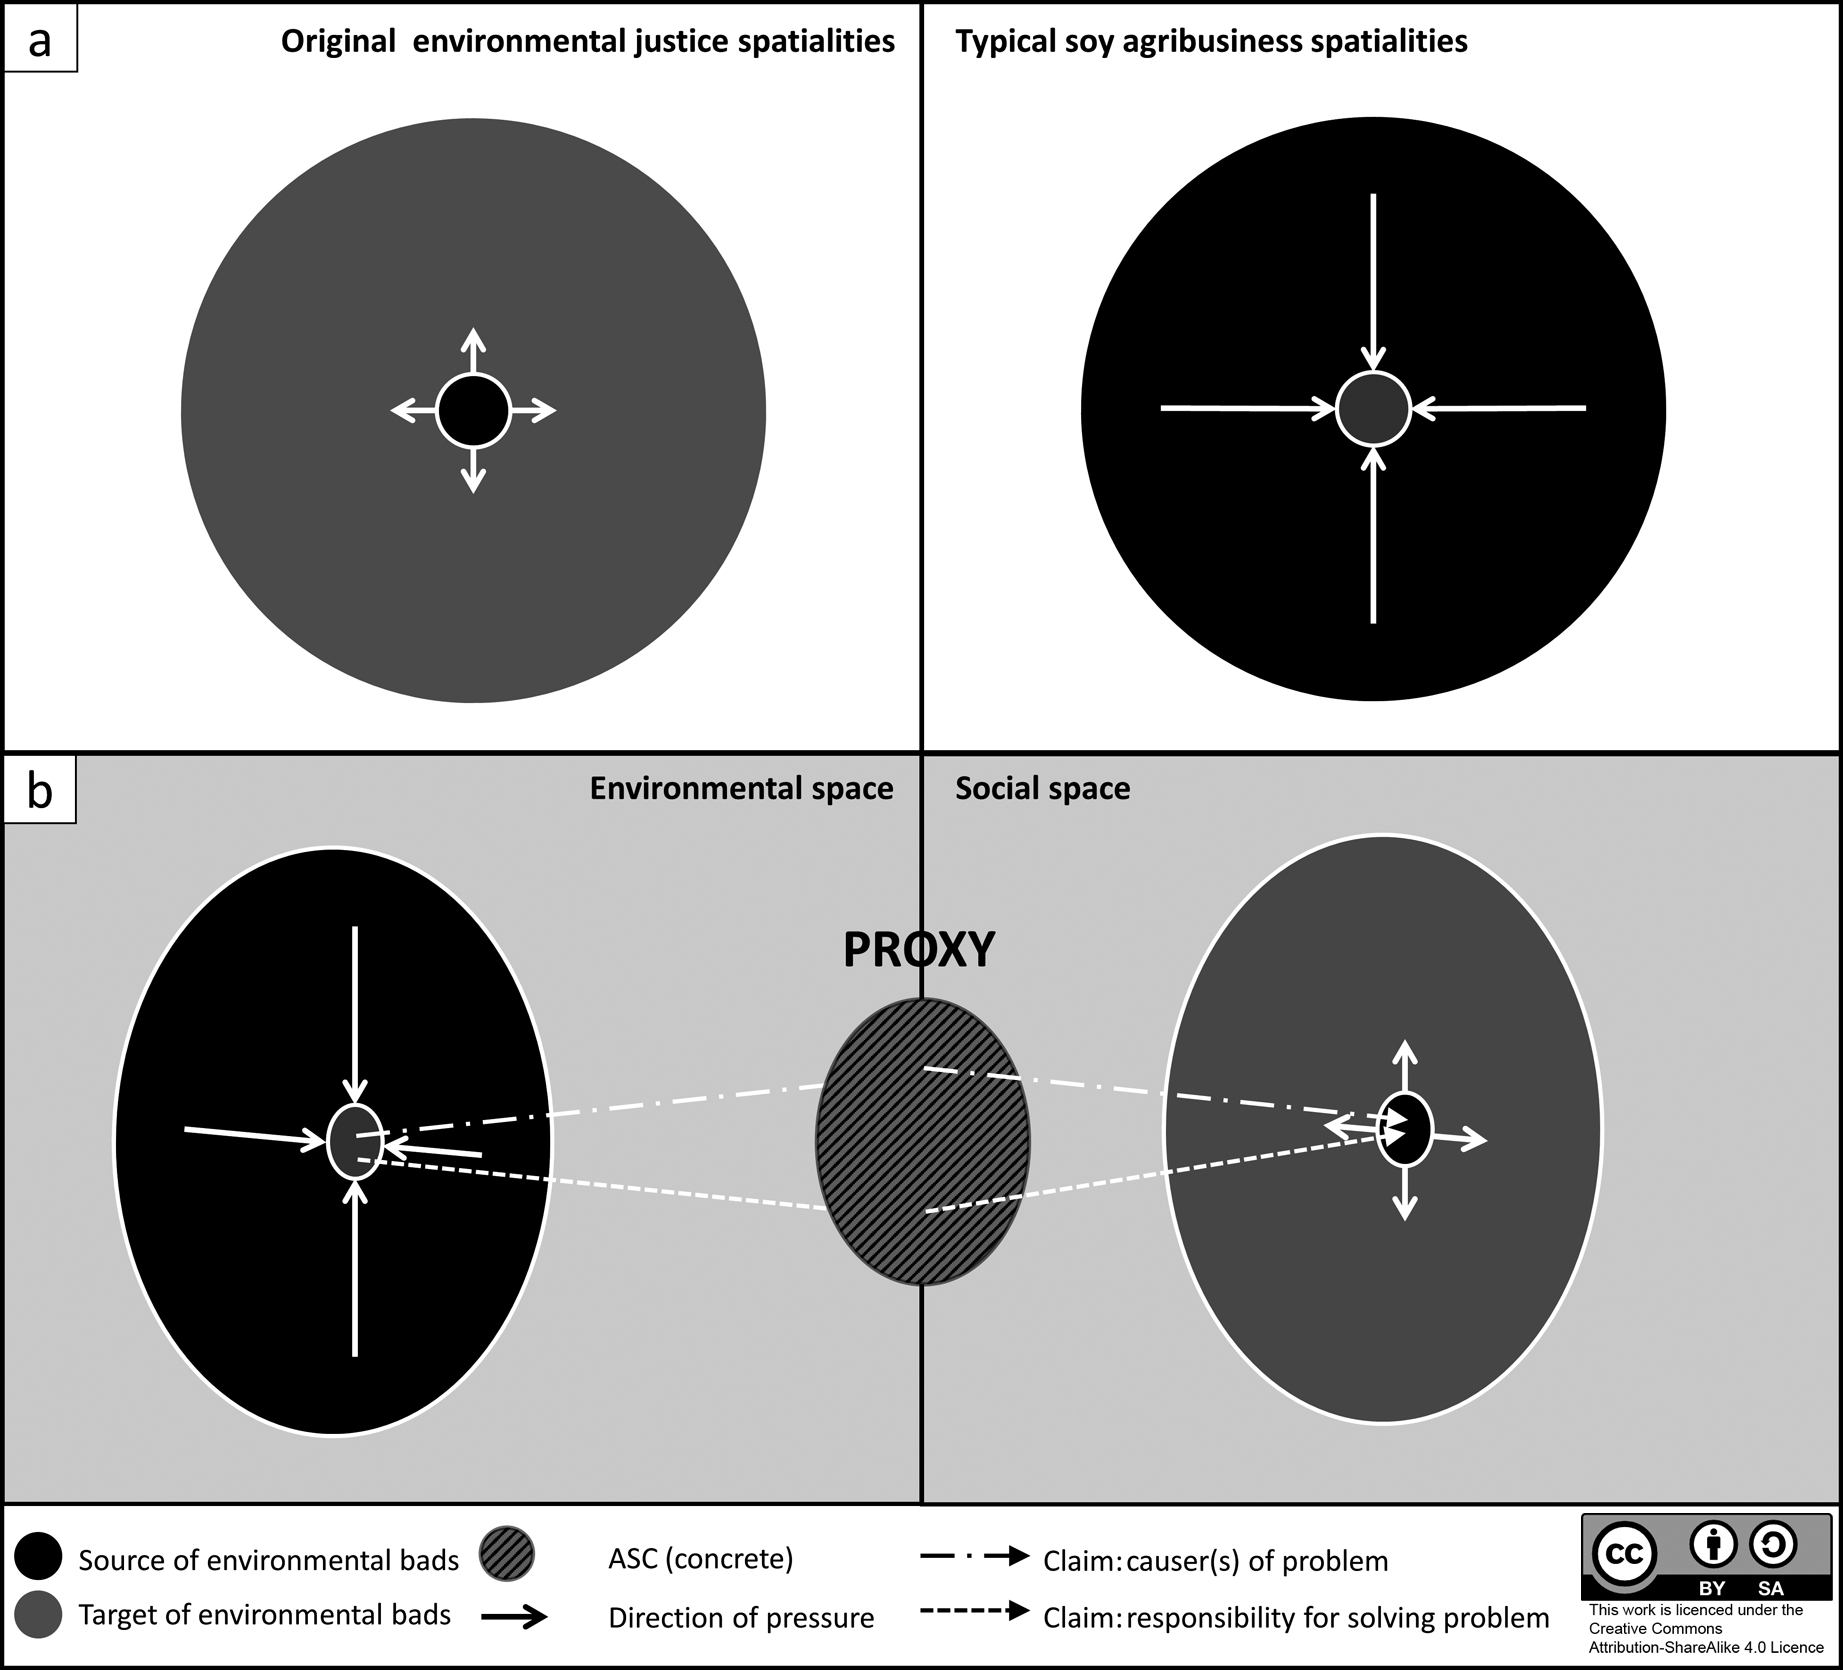
Figure: Comparison of environmental justice concepts

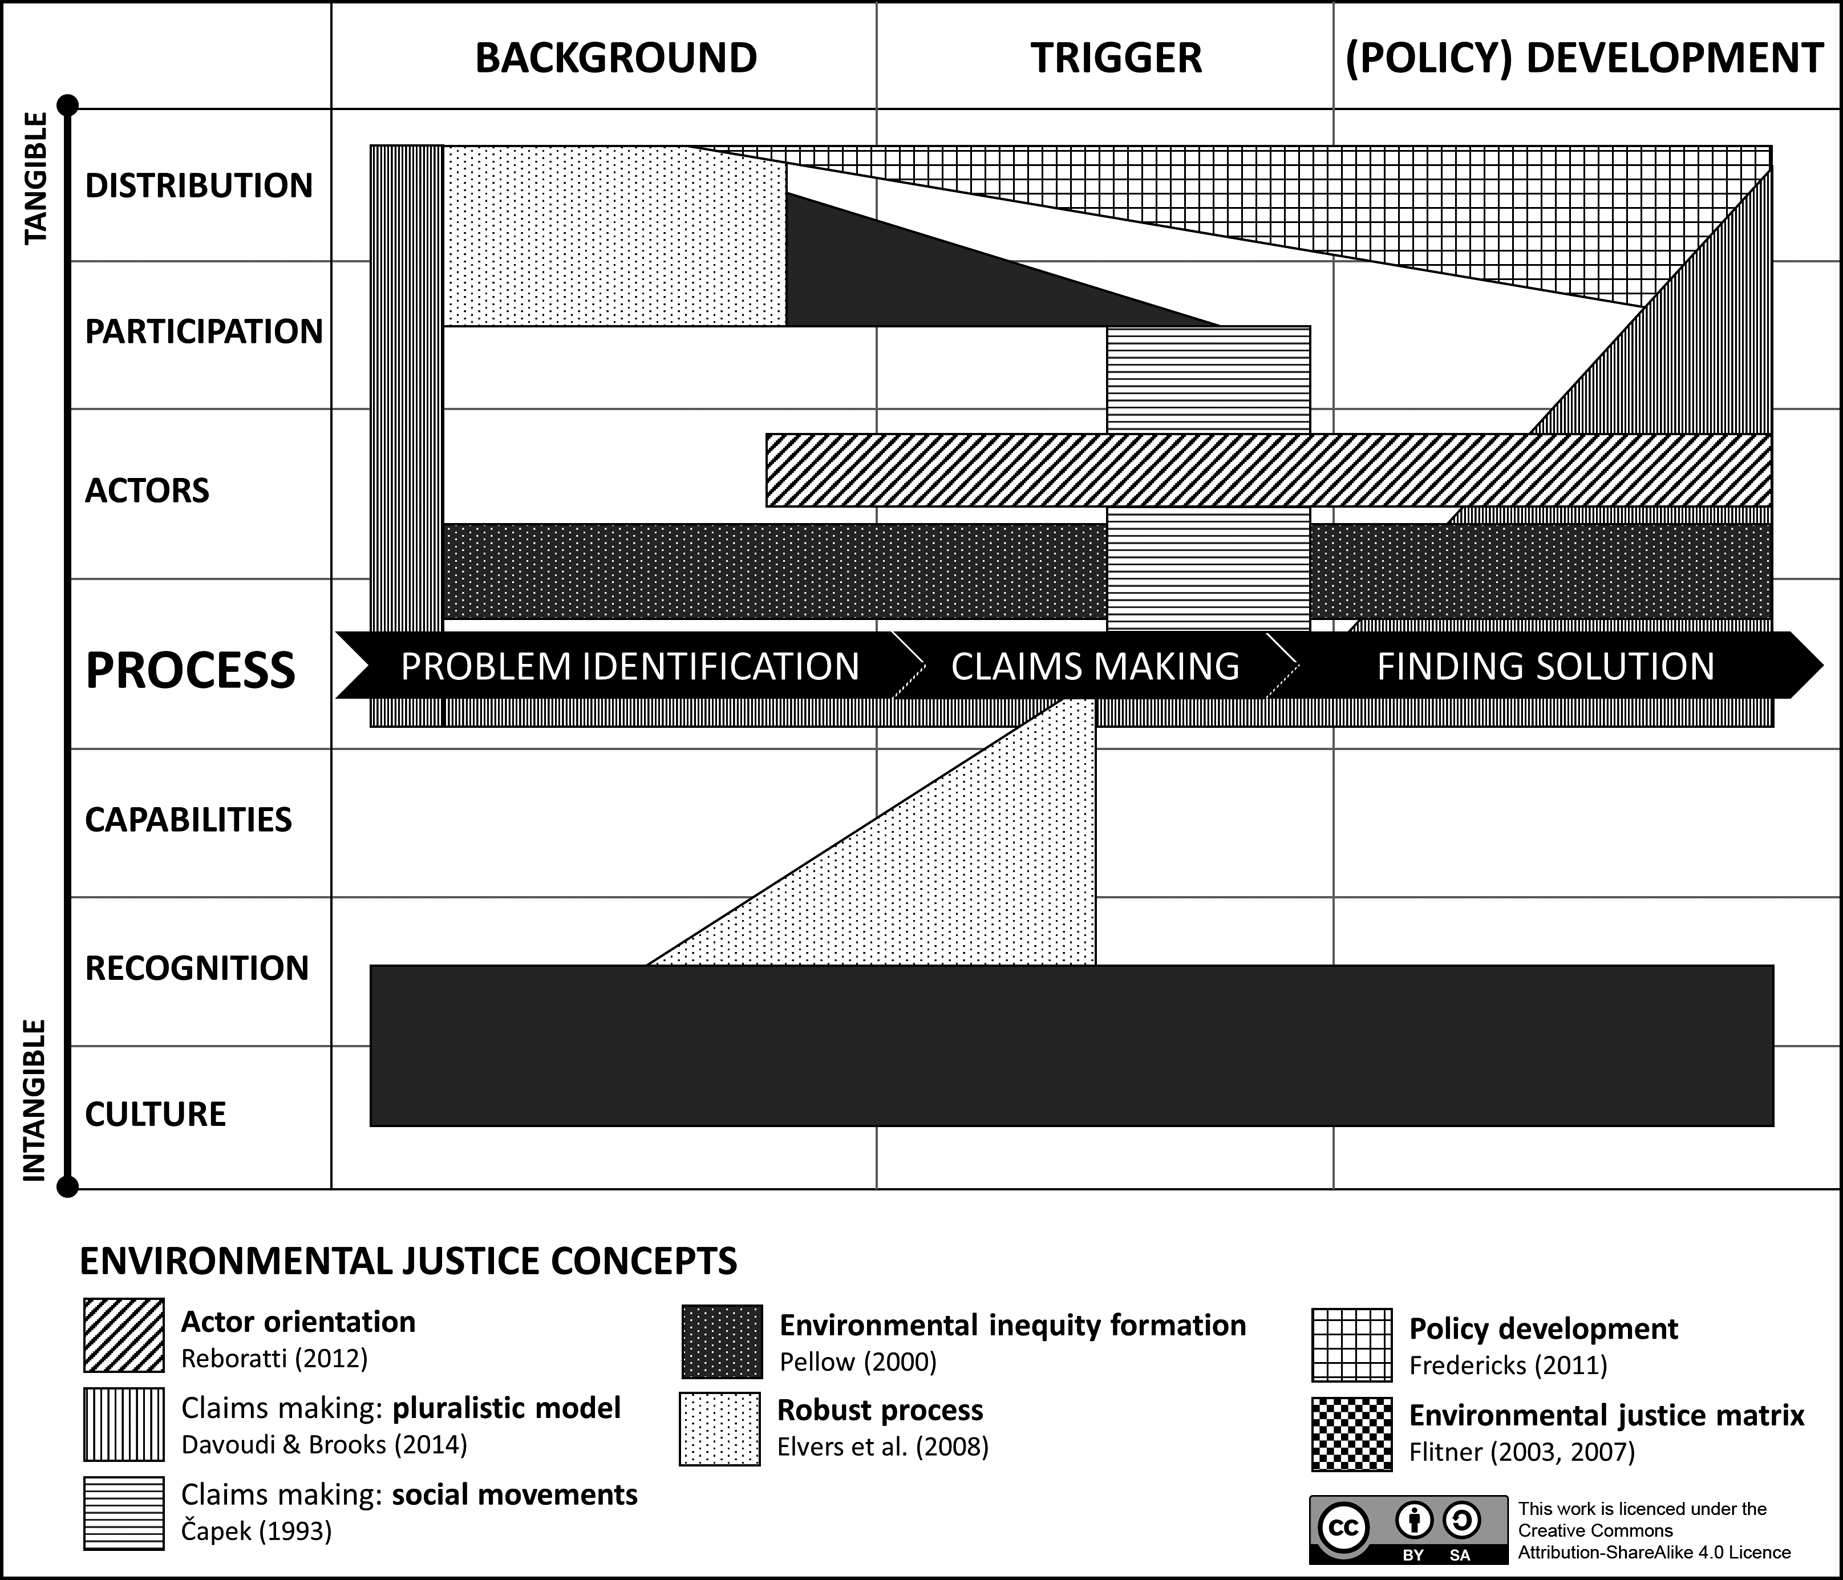
Figure: Environmental Justice Incommensurabilities Framework

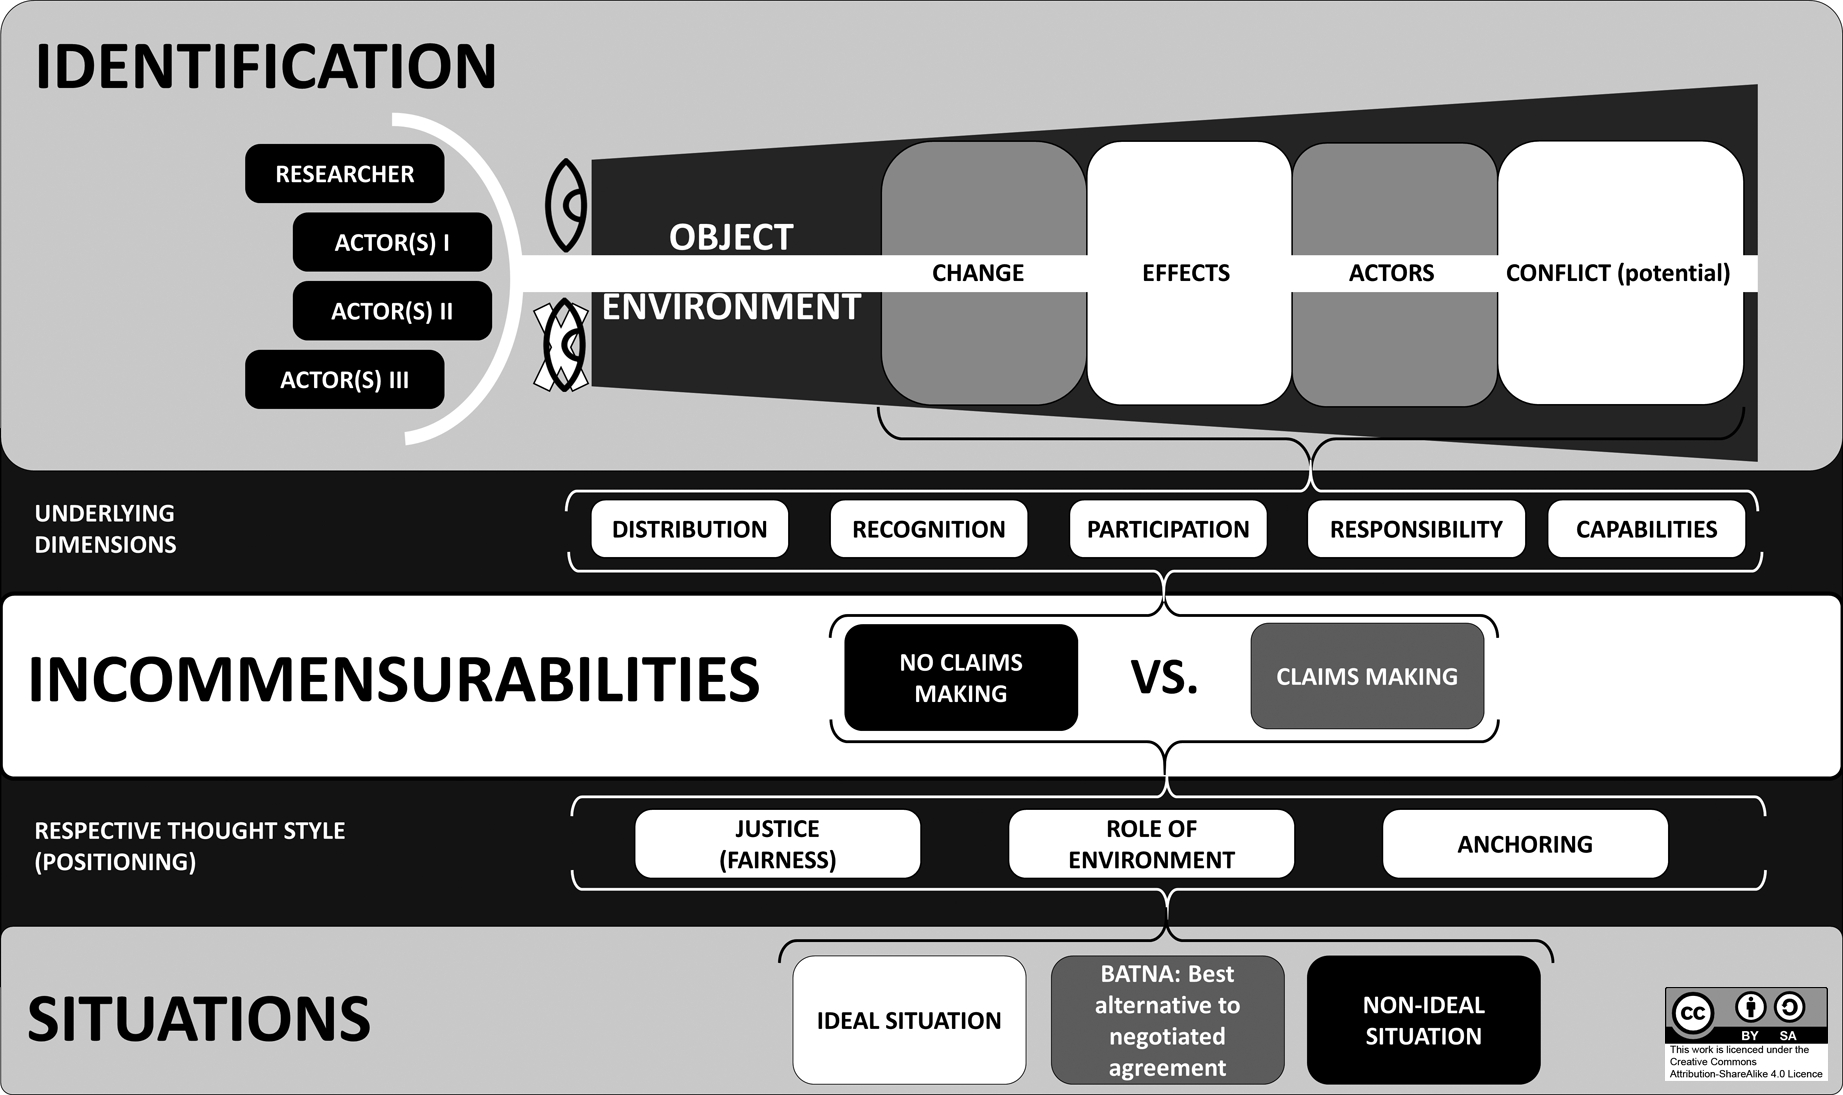
Figure: Directions of environmental bads’ distribution